
February 16th, 2020 by WCBC Radio
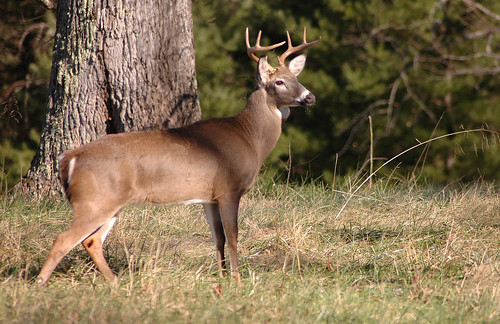
Photo by Steve Edwards
The Maryland Department of Natural Resources reported that deer hunters harvested 79,457 deer during the combined archery, firearms, and muzzleloader seasons, from Sept. 6, 2019 through Jan. 31, 2020.
The statewide harvest included 29,233 antlered and 46,777 antlerless white-tailed deer, plus 1,552 antlered and 1,895 antlerless sika deer. The harvest was 3% higher than the 2018-2019 total of 77,382 deer.
Hunters harvested more than 5,000 deer on Sundays. Hunting deer on Sunday is only permitted during certain weeks in 20 of Maryland’s 23 counties.
Many factors affect the annual deer harvest, including weather, the amount of natural food available to deer, and the economy as it relates to recreational time available.
“We are pleased with the results of this year’s overall deer harvest,” Wildlife and Heritage Service Director Paul Peditto said. “Maryland’s deer population remains very healthy, and deer hunters continue to play the most critical role in the management of this important species.”
The harvest in deer management Region A (Western Maryland) decreased 12%, from 9,705 deer last year to 8,534 this year. Poor weather conditions on key hunting days contributed to the region’s harvest decline. Hunters in the western counties reported 5,056 antlered and 3,478 antlerless deer.
Hunters in Region B — the remainder of the state — harvested 70,923 deer, up 5% from 67,677 deer harvested last year. A total of 25,729 antlered and 45,194 antlerless deer were reported in this region.
Frederick County led the harvest totals again this year with 6,358 deer, followed by Carroll County with 5,553 and Baltimore County at 4,969. Garrett and Washington counties rounded out the top five with 4,607 and 4,041 deer, respectively.
|
Maryland Reported Antlered and Antlerless Deer Harvest |
|||||||||
| Antlered | Antlerless | Total | |||||||
| County | 2019-20 | 2018-19 | % Change | 2019-20 | 2018-19 | % Change | 2019-20 | 2018-19 | % Change |
| Allegany | 1,667 | 2,017 | -17.4 | 1,179 | 1,444 | -18.4 | 2,846 | 3,461 | -17.8 |
| Anne Arundel | 966 | 920 | 5.0 | 1,653 | 1,562 | 5.8 | 2,619 | 2,482 | 5.5 |
| Baltimore | 1,774 | 1,641 | 8.1 | 3,195 | 2,963 | 7.8 | 4,969 | 4,604 | 7.9 |
| Calvert | 639 | 614 | 4.1 | 1,025 | 947 | 8.2 | 1,664 | 1,561 | 6.6 |
| Caroline | |||||||||
| whitetail | 785 | 829 | -5.3 | 1,797 | 1,727 | 4.1 | 2,582 | 2,556 | 1.0 |
| sika | 0 | 0 | * | 1 | 1 | * | 1 | 1 | * |
| Carroll | 2,016 | 2,197 | -8.2 | 3,537 | 3,224 | 9.7 | 5,553 | 5,421 | 2.4 |
| Cecil | |||||||||
| whitetail | 1,226 | 1,237 | -0.9 | 2,468 | 2,269 | 8.8 | 3,694 | 3,506 | 5.4 |
| sika | 1 | 0 | * | 1 | 0 | * | 1 | 0 | * |
| Charles | 1,349 | 1,031 | 30.8 | 1,868 | 1,328 | 40.7 | 3,217 | 2,359 | 36.4 |
| Dorchester | |||||||||
| whitetail | 748 | 734 | 1.9 | 1,203 | 1,161 | 3.6 | 1,951 | 1,895 | 3.0 |
| sika | 1,405 | 1,466 | -4.2 | 1,711 | 1,712 | -0.1 | 3,116 | 3,178 | -2.0 |
| Frederick | 2,543 | 2,692 | -5.5 | 3,815 | 3,853 | -1.0 | 6,358 | 6,545 | -2.9 |
| Garrett | 2,733 | 2,827 | -3.3 | 1,874 | 2,146 | -12.7 | 4,607 | 4,973 | -7.4 |
| Harford | 1,224 | 1,145 | 6.9 | 2,353 | 2,165 | 8.7 | 3,577 | 3,310 | 8.1 |
| Howard | 798 | 741 | 7.7 | 1,470 | 1,286 | 14.3 | 2,268 | 2,027 | 11.9 |
| Kent | 1,162 | 1,144 | 1.6 | 2,020 | 1,949 | 3.6 | 3,182 | 3,093 | 2.9 |
| Montgomery | 1,367 | 1,378 | -0.8 | 2,588 | 2,507 | 3.2 | 3,955 | 3,885 | 1.8 |
| Prince George’s | 885 | 799 | 10.8 | 1,311 | 1,263 | 3.8 | 2,196 | 2,062 | 6.5 |
| Queen Anne’s | 1,127 | 1,133 | -0.5 | 2,248 | 2,060 | 9.1 | 3,375 | 3,193 | 5.7 |
| St. Mary’s | 962 | 740 | 30.0 | 1,547 | 1,137 | 36.1 | 2,509 | 1,877 | 33.7 |
| Somerset | |||||||||
| whitetail | 649 | 746 | -13.0 | 1,488 | 1,292 | 15.2 | 2,137 | 2,038 | 4.9 |
| sika | 8 | 11 | * | 8 | 5 | * | 16 | 16 | * |
| Talbot | 717 | 784 | -8.5 | 1,637 | 1,535 | 6.6 | 2,354 | 2,319 | 1.5 |
| Washington | 1,846 | 2,166 | -14.8 | 2,195 | 2,454 | -10.6 | 4,041 | 4,620 | -12.5 |
| Wicomico | |||||||||
| whitetail | 975 | 1,036 | -5.9 | 1,963 | 1,819 | 7.9 | 2,938 | 2,855 | 2.9 |
| sika | 83 | 110 | * | 114 | 81 | * | 197 | 191 | * |
| Worcester | |||||||||
| whitetail | 1,075 | 1,148 | -6.4 | 2,343 | 2,158 | 8.6 | 3,418 | 3,306 | 3.4 |
| sika | 55 | 22 | * | 61 | 26 | * | 116 | 48 | * |
| Total | 30,785 | 31,308 | -1.7 | 48,672 | 46,074 | 5.6 | 79,457 | 77,382 | 2.7 |
| *Small sample size | |||||||||


.jpg)