
June 13th, 2021 by WCBC Radio
Month-long Season Started with Youth Hunt
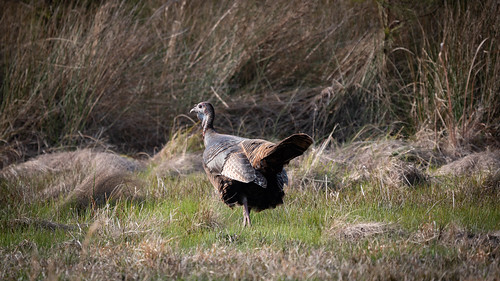
Photo by Stephen Badger/Maryland Department of Natural Resources
Maryland hunters harvested 3,910 wild turkeys during the spring 2021 regular and junior turkey seasons, the Maryland Department of Natural Resources reported. This year’s harvest was 9% below the record harvest of 4,303 set in 2020, but still 4% above the 10-year average.
“Turkey populations in much of the state have increased significantly in the past decade,” Wildlife and Heritage Service Director Paul Peditto said. “It is not unexpected to see a stabilization or slight decline in both numbers of turkeys and the spring harvest following a period of growth.”
The percentage of juvenile turkeys or “jakes” reported in the harvest declined to 16%. This supports other survey data showing that summer 2020 was a below-average year for turkey production across most of the state.
Despite a decline in harvest in many counties, the top three counties all posted harvests above 300 birds. Garrett County reported 374 turkeys, followed by Charles County with 353, and Washington County with 345.
Youth hunters kicked off the spring turkey season statewide on April 17 with the Junior Turkey Hunt. An additional junior hunting opportunity occurred on April 18 in select counties. In total, junior hunters harvested 255 wild turkeys, accounting for about 6% of the total spring harvest.
Total harvests by county are below:
|
County |
2017 |
2018 |
2019 |
2020 |
2021 |
|
Allegany |
293 |
250 |
278 |
286 |
266 |
|
Anne Arundel |
58 |
49 |
74 |
81 |
64 |
|
Baltimore |
51 |
55 |
56 |
65 |
53 |
|
Calvert |
59 |
76 |
68 |
82 |
58 |
|
Caroline |
149 |
135 |
152 |
180 |
149 |
|
Carroll |
103 |
103 |
73 |
93 |
104 |
|
Cecil |
87 |
69 |
89 |
94 |
80 |
|
Charles |
320 |
336 |
348 |
369 |
353 |
|
Dorchester |
303 |
212 |
221 |
211 |
197 |
|
Frederick |
332 |
313 |
304 |
348 |
281 |
|
Garrett |
429 |
412 |
429 |
387 |
374 |
|
Harford |
127 |
105 |
124 |
88 |
104 |
|
Howard |
24 |
36 |
33 |
34 |
35 |
|
Kent |
174 |
168 |
166 |
206 |
151 |
|
Montgomery |
135 |
149 |
135 |
162 |
154 |
|
Prince George’s |
91 |
76 |
105 |
109 |
99 |
|
Queen Anne’s |
160 |
115 |
145 |
144 |
120 |
|
Somerset |
163 |
145 |
129 |
171 |
180 |
|
St. Mary’s |
202 |
191 |
188 |
226 |
187 |
|
Talbot |
94 |
80 |
87 |
95 |
80 |
|
Washington |
426 |
459 |
414 |
439 |
345 |
|
Wicomico |
175 |
139 |
155 |
193 |
181 |
|
Worcester |
220 |
188 |
229 |
240 |
295 |
|
Statewide |
4,175 |
3,861 |
4,002 |
4,303 |
3,910 |

.jpg)